
There is a drawing at the Royal Collection Trust in Windsor that looks, at first glance, like a figure study. A male torso, arms and legs extended in two positions simultaneously, inscribed within a circle and a square. Look more closely and you realize it is also a geometry problem: Leonardo da Vinci is working out the mathematical proportions of the ideal human body as described by the Roman architect Vitruvius. The drawing is simultaneously a work of art and a scientific diagram. Making it required knowledge of anatomy, geometry, architectural theory, and figure drawing. There was no contradiction in that for Leonardo, because in 1490, those were not separate fields.
That unity fractured over the following four centuries. By the late 1800s, science and art had separate institutions, separate professional identities, and increasingly separate languages. But the split was never complete, and the evidence of their continued conversation is scattered across the history of both: in Florence Nightingale's mortality charts, in the radiolarian drawings of Ernst Haeckel, in fractal geometry, in today's AI-generated images. This guide traces where visual art and scientific inquiry have genuinely overlapped, and what each field gained from the encounter.
Leonardo: The Original Synthesis
Leonardo da Vinci performed more than 30 human dissections by his own account. The anatomical drawings that survive from those sessions, around 200 sheets now split between the Royal Collection at Windsor and other collections, show a level of accuracy that was not matched in any printed anatomical atlas until Andreas Vesalius published "De Humani Corporis Fabrica" in 1543, more than 30 years after Leonardo's death.
What makes those drawings art as well as science is not just technical precision. It is the quality of attention. Leonardo's study of the heart's valves, made around 1513, shows the aortic valve in multiple views with annotations about how the blood flow creates vortices that close the valves without turbulence. He was wrong about some aspects of circulation, but his physical intuition about the fluid dynamics was essentially correct, and it was confirmed by cardiologists using MRI scanners only in the 21st century. The Royal Collection Trust's Leonardo catalogue documents these drawings in full. Leonardo was not making art that happened to include scientific content. He was trying to understand how things work, and drawing was his primary tool for that investigation.
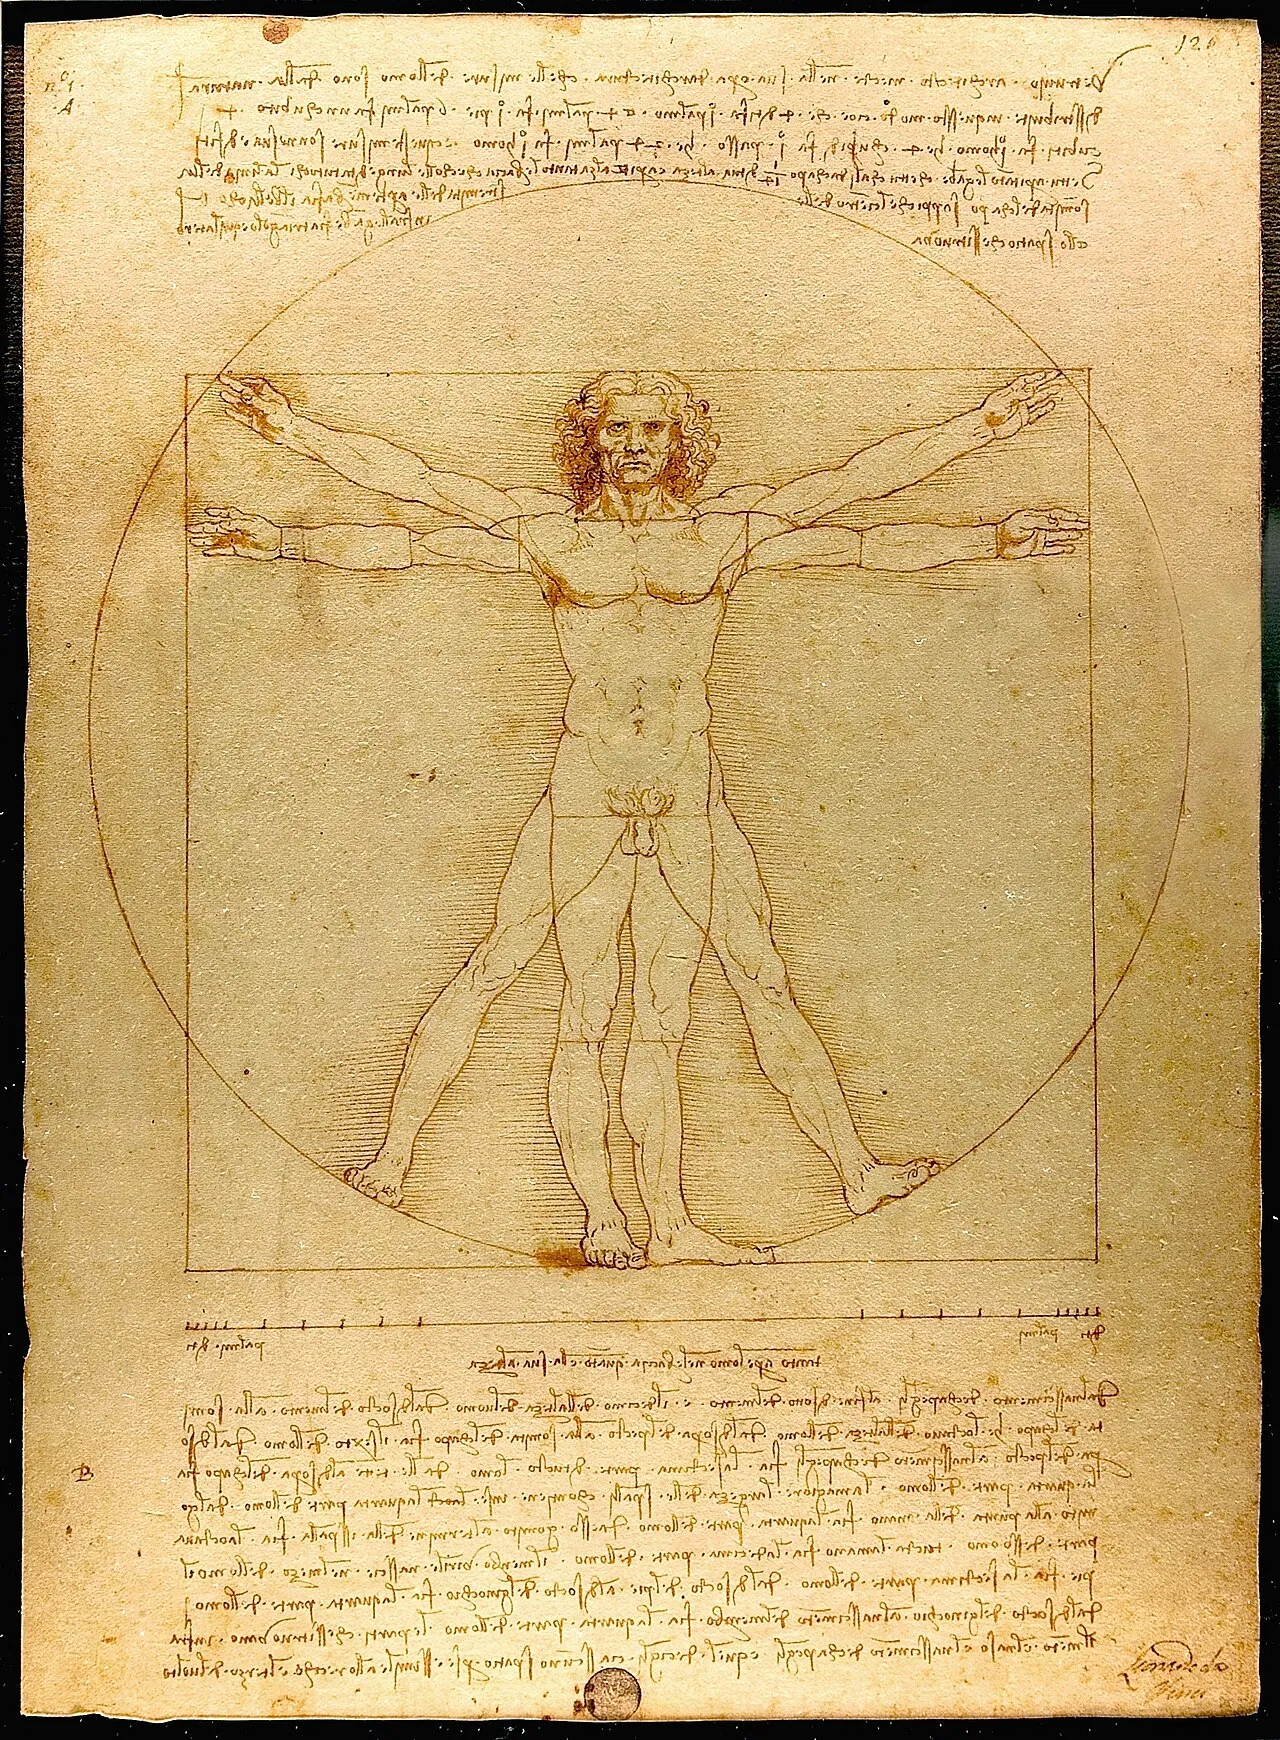
Leonardo da Vinci, "Vitruvian Man" (c.1490), pen and ink on paper, 34.4 x 25.5 cm. Gallerie dell'Accademia, Venice. The drawing is simultaneously a figure study, a geometry problem, and a commentary on Vitruvian architectural theory. Image: Public domain, via Wikimedia Commons
Our full profile of Leonardo da Vinci: Painter, Scientist, and the Renaissance Ideal covers his full range of work. The key point here is simpler: for Leonardo, asking whether his anatomical drawings were "art" or "science" would have been a meaningless question. They were observations, recorded with the best visual tools he had. The disciplines had not yet separated into different buildings with different faculties and different journals.
Ernst Haeckel: When Scientific Illustration Became Art Nouveau
The German biologist Ernst Haeckel published "Kunstformen der Natur" (Art Forms in Nature) in ten installments between 1899 and 1904. The 100 lithographic plates in the completed work show radiolarians, jellyfish, sea anemones, diatoms, bat skulls, and dozens of other natural forms drawn with a compositional precision that goes beyond scientific documentation into something else entirely.
Haeckel was a committed Darwinist and a controversial one, who made claims about human racial hierarchies that were scientifically unfounded and morally repugnant. His scientific reputation is complicated. His visual work is not. The radiolarian plates in particular, showing the glass skeletons of single-celled marine organisms, reveal geometric complexity that no one had represented before at this scale. Each organism has a different structural plan: some are radially symmetric like snowflakes, others bilaterally symmetric, others asymmetric in ways that appear random until you understand the underlying growth logic. Haeckel showed the variety with the same systematic thoroughness that a comparative anatomist would apply to vertebrate skeletons.
The influence on Art Nouveau was direct and documented. René Binet, who designed the monumental Porte Monumentale entrance gate for the 1900 Paris World's Fair, based the structure explicitly on Haeckel's illustration of a radiolarian species called Medusetta ansata. Louis Sullivan's foliate ornamental designs for Chicago skyscrapers drew on the same imagery. The biomorphic, flowing forms that characterize Art Nouveau architecture and decorative arts came substantially from Haeckel's plates. Scientific illustration became a design vocabulary for an entire movement.
Fractal Geometry and the Beauty of Self-Similarity
Benoit Mandelbrot coined the word "fractal" in 1975 to describe geometric forms that exhibit self-similarity at different scales: a coastline that looks roughly the same whether you view it from 10,000 feet or 10 feet, a fern frond whose overall shape is repeated in each leaflet, a snowflake whose branching pattern recurs at every level of magnification. His 1982 book "The Fractal Geometry of Nature" argued that fractals were not mathematical curiosities but the actual geometric language of the natural world, the language that smooth Euclidean geometry had systematically failed to describe.
When computing power made it possible to visualize fractals with color and high resolution from the mid-1980s onward, the results looked organic. The Mandelbrot set, generated by a simple iterative equation applied to complex numbers, produces images of infinite detail: zoom in on any boundary region and you find new structures that resemble, without exactly repeating, the overall form. The images look like coral, like coastlines, like branching trees. They are purely mathematical objects generated by arithmetic, but they look like things that grow. Viewers with no mathematical background consistently find them beautiful. Researchers have proposed various explanations, including the idea that fractal patterns at certain scaling ratios match the statistical structure of natural environments our visual systems evolved to process. Our guide to Digital Art: The Modern Creative Frontier covers the broader field of computational visual art.
Data Visualization: Charts That Changed Policy
Florence Nightingale is remembered as a nursing reformer. She is less often remembered as a statistician who understood that data visualization could do political work that tables of numbers could not. Her polar area diagrams from 1858, showing causes of mortality among British soldiers in the Crimean War, were designed specifically to persuade politicians and military administrators who would not read a statistical report. The diagrams showed, visually and immediately, that far more soldiers were dying from preventable infections than from battle wounds. Her sanitary reforms, which followed partly as a result of this campaign, are estimated to have saved tens of thousands of lives.
Nightingale understood something that remains true: the design of a chart is not a neutral presentation of data. It is a rhetorical act. The choice of what to show, how to scale it, what colors to use, what to label, all of these are decisions that shape what the viewer understands. Edward Tufte's "The Visual Display of Quantitative Information" (1983) formalized this insight into a set of design principles, arguing that the best charts maximize the ratio of information to ink and eliminate any visual element that does not represent data. His analysis of the Challenger space shuttle disaster argued that a different visualization of the O-ring temperature data already available before the launch would have made the danger clear enough to ground the flight. The design of a chart killed seven people. That is not an exaggeration.
Contemporary Art-Science Work
Since the 1990s, art and science have developed institutional structures for collaboration: artist residencies in scientific laboratories, funding programs like the Wellcome Trust's Sciart initiative in the UK, and academic programs treating art-science collaboration as a legitimate research methodology. The work produced in these contexts is genuinely hard to categorize.
Eduardo Kac's transgenic rabbit "Alba" (2000), whose fur glowed green under ultraviolet light due to the insertion of a green fluorescent protein gene from a jellyfish, raised questions about genetic modification and the ethics of creating novel organisms that scientific papers could not raise in the same way. The work did not argue that transgenic art was right or wrong. It made the possibility real and visible in a form that demanded a response. Neri Oxman's work at MIT's Mediated Matter Group used computational design derived from biological growth principles to produce architectural structures, wearable objects, and construction materials that could not have been designed by conventional engineering methods alone.
Generative AI image systems, which have moved from specialist tools to mainstream cultural phenomena since 2022, represent the most recent and most contested intersection of art and science. The mathematical processes underlying these systems, large neural networks trained on billions of human-made images, produce outputs that are visually sophisticated by any standard measure. Whether they constitute a form of creativity, and what that question even means, is a debate that neither artists nor scientists have resolved. Our guide to AI-Generated Art: Creativity, Ethics, and the Question of Authorship covers that debate in full.
What Each Field Gets from the Other
Science needs visual intelligence more than scientists typically acknowledge. The ability to represent a complex three-dimensional structure clearly on a two-dimensional page, to choose what to show and what to omit, to design a diagram that communicates rather than merely records, these are aesthetic skills. The difference between a good scientific illustration and a poor one is often the difference between a finding that influences other researchers and one that does not.
Art, in return, gets from science a rigorous relationship to the observable world: an insistence that what you depict must correspond to something real, that observation precedes representation, that being wrong about what you are looking at matters. Leonardo's anatomical drawings are more powerful than most Renaissance figure studies precisely because they were made from cadavers rather than from idealized convention. The friction between what the body actually looked like and what classical proportion said it should look like produced something more interesting than either alone would have.
That productive friction between observation and convention is what makes the art-science intersection worth revisiting. Neither field is best understood in isolation from the other. For the broader context of how visual art developed the tools it uses to see the world, see The Complete Guide to Art Movements: A Timeline from Ancient to Now. Which scientific image do you consider a genuine work of art? Leave your answer in the comments.


